
Worst Building Analyis
- Indoor and Outdoor
- 1m resolution
- Richer dataset unrelated with 10x more points than competetive benchmarking datasets
- Ability to perform predictive analytics on data traffic trends
- Includes all handsets not just android
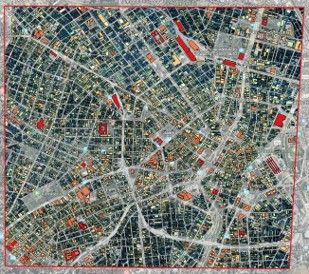
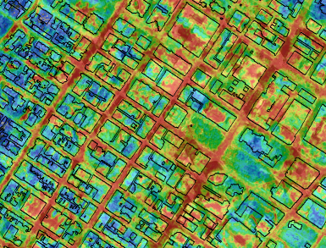
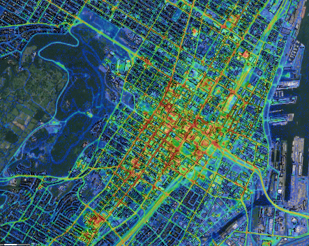
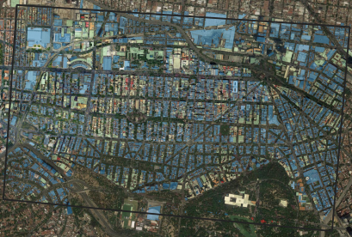
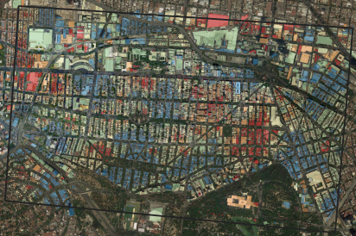
Some results are presented in the pictures below
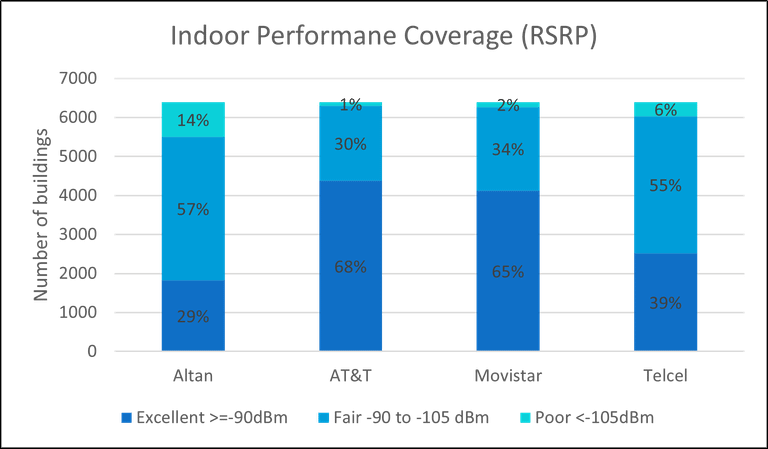
Indoor Competitive Benchmarking
The presented statistics represent the Indoor coverage (RSRP) with respect to the number of buildings.
Full indoor analysis without drive or walk testing
Below we have presented a sample of the coverage analysis (RSRP) for various network providers.
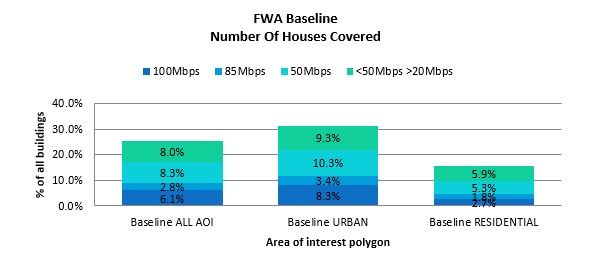
FWA Business Analytics
Objective: Where to deploy FWA ?
Maximize return of investments by making smart deployment decisions.
Tabular outputs
- Residential/SMB house density
- Best advertised broadband speed
- Number of broadband competitors
- Number of people that work from home
- Average family size residential vs business locations
- And many more attributes possible
Case: Finding FWA Antenna Mounting Locations and House Performance
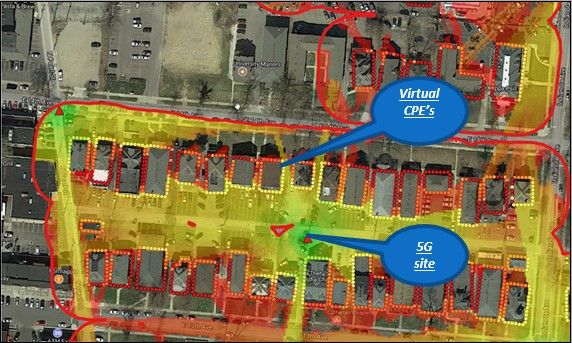
5G FWA Analytics
Customer: I need to know which houses are covered so that:
- I can evaluate my return on investment
- When a customer walks into my sales office I will know what throughput package I can sell to them
- I can minimize my CPE install truck roll cost by knowing where to mount the CPE
Our solution : Custom algorithms to determine which houses are covered andwhere to install the CPE
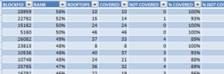
5G FWA analytics
- Create virtual CPE's around each building
- Evaluate the design at each CPE
- Count the number of buildings covered
- Indentify the best location to mount the CPE
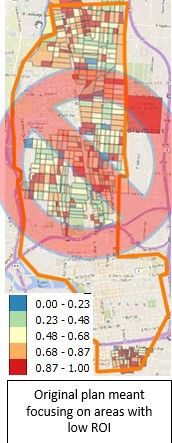
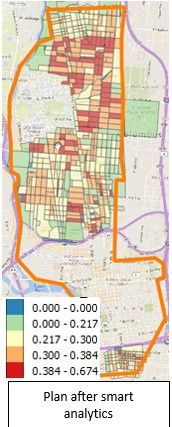
SITE PRIORITIZATION (ROI)
Case: Deployment Return On Investment
Business analytics to prioritize and optimize CapEx and ROI:
- Using our 1m high resolution traffic maps we can prioritize 5G mobility traffics
- Business analytics are as important to some customers as the technical design
- In this case study the customer only wanted to deploy 5G mobility in high traffic areas to maximize the ROI
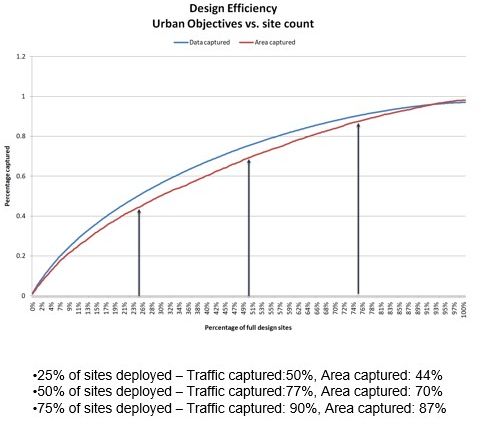
Our solution : We can Quantify each site by how much traffic it captures and how far it goes then rank and prioritize each site .
Customer : I need to know which sites are going the farthest and capturing the most amount of traffic, so I know whcih sites build and which ones not to build.
Other "What If" 5G Analysis
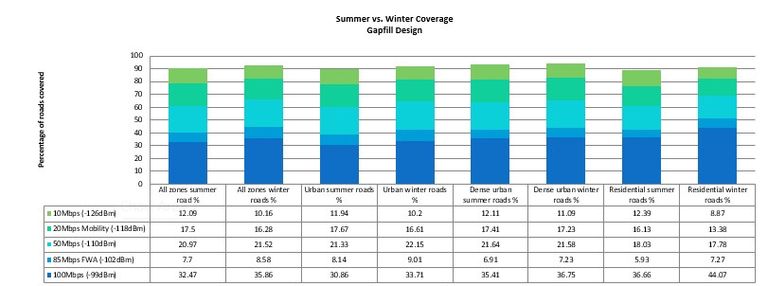
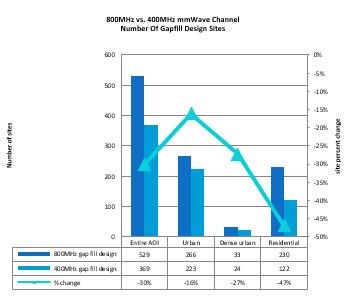
mmWave What if Scenarios :
- Design for summer or winter?
- Deploy low or high frequency for 5G
- How much bandwidth to purchase? s
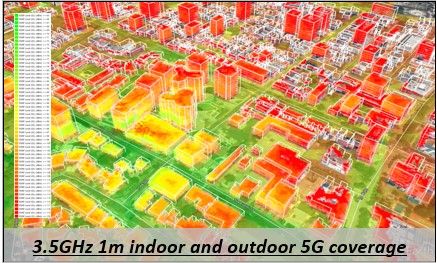
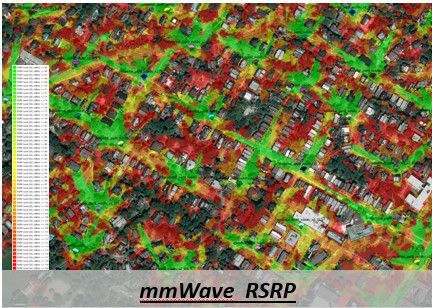
High Resolution RF Modelling
All our analysis are performed at 1m resolution in 3D
Propagation Modeling for 5G
Customer :
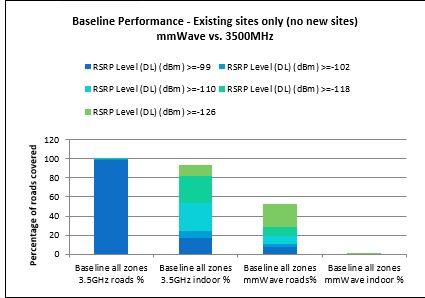
1) I want to know what buildings and what floors will have 3.5GHz 5G coverage
2) I need to know tree canopy impact to my mmWave design site count
3) Simulate winter coverage by reducing tree canopy loss
4) I don’t have 1m GIS data, can you create it for me at a lower cost than purchasing it?
Our solution : We have the ability to generate 3D 1m GIS data in house for less than GIS vendors charge. All our simulations are performed at 1m resolution in 3 dimensions
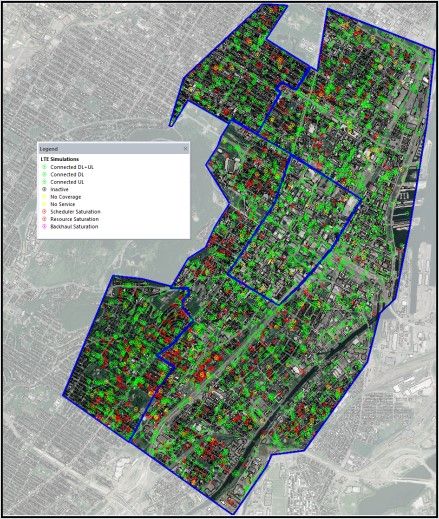
Mobility/FWA Combined Analysis
•We can design to a 5G mobility target and find opportunistic FWA
•We can design to a 5G FWA target and quantify opportunistic mobility
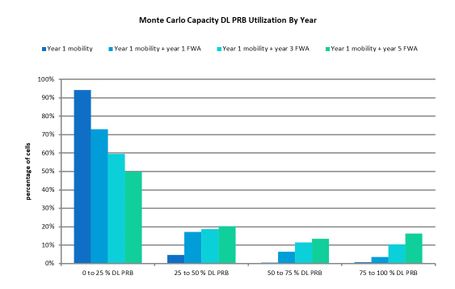
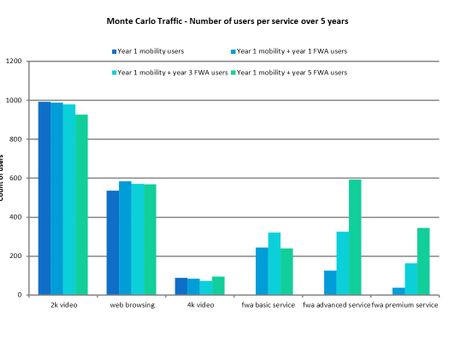
•Full Monte Carlo simulations that use mobility traffic maps + “per house” traffic maps
Customer:
Strength test network capacity over time to find out what happens as I add mobility + FWA users in the urban and residential areas
Our Solution: Full Monte Carlo simulations that include both mobility and “per building” traffic maps
© Copyright. All rights reserved.
We need your consent to load the translations
We use a third-party service to translate the website content that may collect data about your activity. Please review the details in the privacy policy and accept the service to view the translations.